The Reality Of The Real Estate Market Right Now

The Good Brigade
It was 2009 and the depths of the great financial crisis (“GFC”). U.S. home prices were in freefall, foreclosures reached record levels, and it seemed the real estate nightmare would never end.
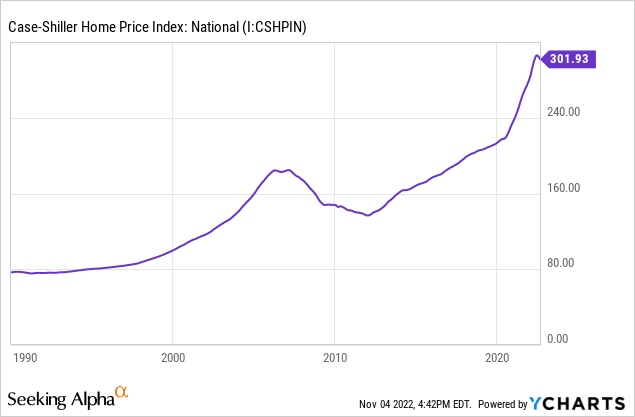
It took a couple more years, but the market finally shook it off and prices eventually eclipsed their previous highs. During the COVID pandemic, home prices shot up into what looks like a blow-off top.
Chart 1: US Home Prices
A pullback was inevitable. Last year I wrote that all good things come to an end, including the easy money from a decade-long rally in housing prices. Chart 2 shows how peaks in home sales activity (blue line, green circles) historically lead prices (red line). I noted the divergence in June 2021 (green arrows) was untenable, and I expected a reversion one way or another.
Chart 2: Home Sales vs Prices
New Homes Sales and Home Prices (FRED)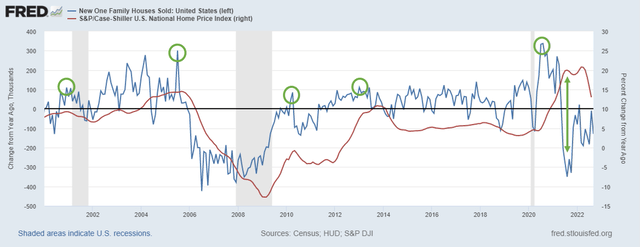
It seems that time is upon us. Home prices teeter on the precipice and a growing chorus of people warn of a housing bust that could be worse than what happened in the GFC.
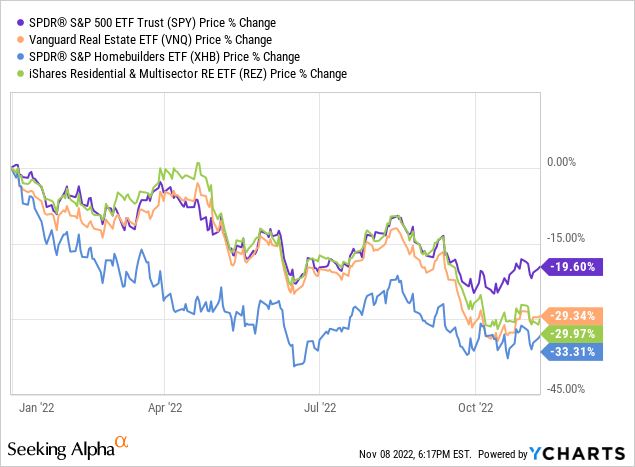
Financial markets are also pessimistic about housing. U.S. real estate-focused funds like the Vanguard Real Estate ETF (VNQ), the SPDR S&P Homebuilders ETF (XHB), and the iShares Residential & Multisector Real Estate ETF (REZ) have all underperformed the S&P 500 (SPY) by wide margins year-to-date.
Chart 3: Real Estate Funds vs S&P 500
The negative sentiment is understandable because the runup in home prices feels eerily similar to 2006. But while another GFC-style crash is possible, there are a number of reasons why 2022 may not experience nightmares of the past.
Supply and demand
We start with simple supply and demand. Many assume population growth drives housing demand. The thinking is if population growth decreases, then housing demand also decreases (and vice versa).
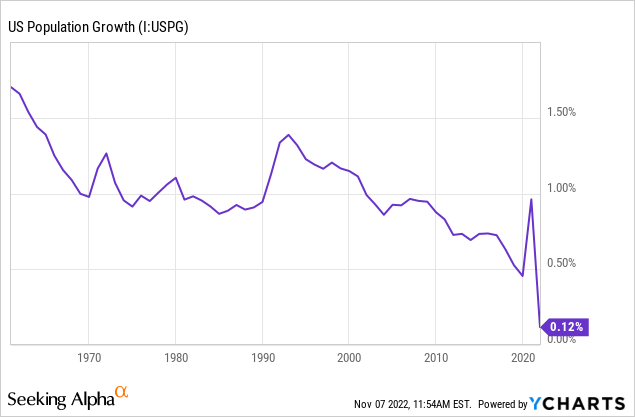
Population growth in the U.S. has declined for decades. It also saw a precipitous drop during the pandemic. Some believe this will fuel a near-term drop in housing demand.
Chart 4: US Population Growth
That seems logical, and population growth does affect housing demand in the long run. However, under normal circumstances, population growth has less effect on demand in the short run.
Babies do not buy houses and adults buy houses regardless of children. In reality, the actual driver of housing demand (at least short-term) is household formation (“HF“). HF can involve population growth, but it does not need to.
Think of adult children living with their parents. Many will move out and start their own households even before children of their own, that is HF. During the pandemic, the U.S. experienced a sudden drop in HF as an increased number of adult children moved in with their parents (Chart 5).
Chart 5: Household Formation
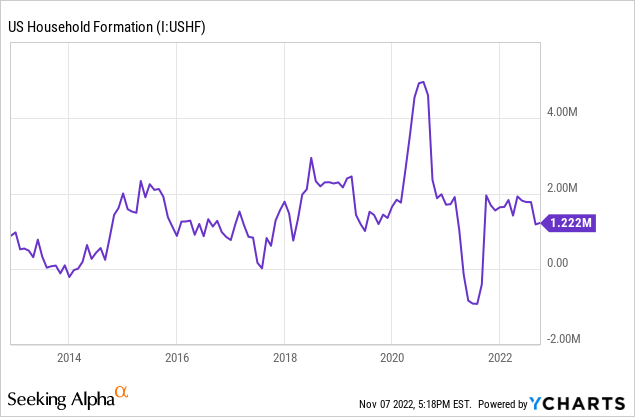
However, HF rebounded after 2020 and the latest figures are back near the long-term trend of about 1.1 million new households per year. In other words, the real driver of housing demand (household formation) continues as normal regardless of population growth.
On the supply side, some believe a rise in new home-building activity will leave the market flooded with inventory. Housing starts have increased over the past decade (Chart 6), but there are a few important points to consider.
Chart 6: Housing Starts
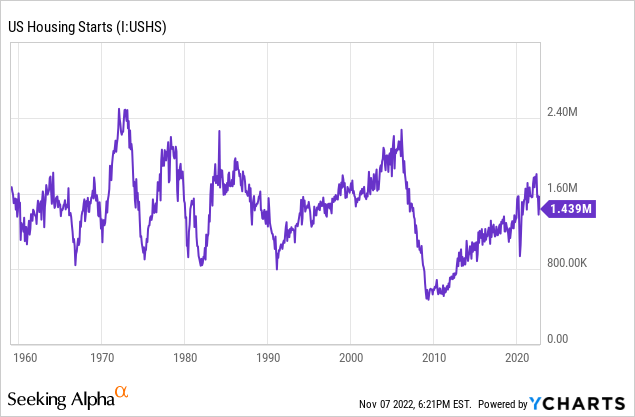
First, housing starts are still well below the peak levels reached during the financial crisis.
Second, there were 17.7 million new household formations between 2006 to 2021.
And third, there was a shortage of new housing built over that same period (based on 17.5 million housing starts).
This is summarized in Chart 7 with data from the US Census Bureau.
Chart 7: Housing Starts vs Households
FRED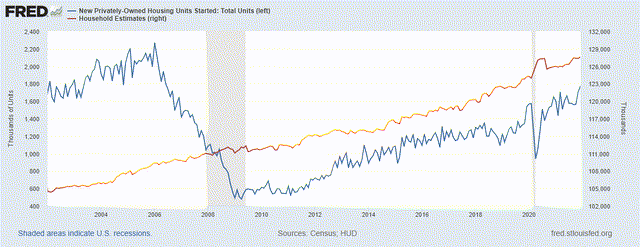
The data above include all dwelling types. Assuming households prefer single-family residences (vs shared), another issue is apparent.
From 2006 to 2021 only 12.6 million single-family homes were built. That implies a shortage of single-family home supply even without considering the additional demand from replacements, investments, and moves.
Despite stories about how real estate markets will be flooded with supply, in reality, the US has record-low inventory (Chart 8) and a shortage of housing driven by years of underbuilding and restrictive government policy.
Chart 8: Total Housing Inventory
TradingEconomics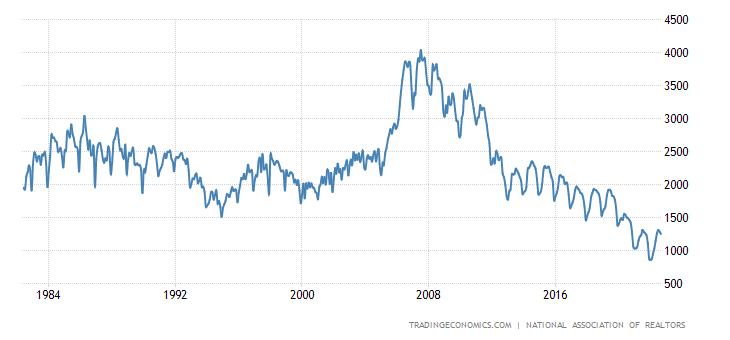
Loan quality
An important contrast from the GFC years is the quality of loans. A serious problem leading up to the financial crisis was loose standards in mortgage underwriting.
Many subprime loans offered zero down payment programs to borrowers with poor credit. Some loans even allowed borrowers to mortgage more than 100{73375d9cc0eb62eadf703eace8c5332f876cb0fdecf5a1aaee3be06b81bdcf82} of the property value (>100 {73375d9cc0eb62eadf703eace8c5332f876cb0fdecf5a1aaee3be06b81bdcf82} LTV) with no income, no job, and no assets (aka “NINJA” loans).
In addition, many subprime loans originated as adjustable rate mortgages (ARMs) with low initial rates and payments that made it easier for borrowers to get approved and concealed under-qualification of buyers.
In the current real estate cycle lenders were more conservative. Lenders no longer offer 100{73375d9cc0eb62eadf703eace8c5332f876cb0fdecf5a1aaee3be06b81bdcf82}+ LTV NINJA loans. Also, the percentage of mortgages that were adjustable fell below 5{73375d9cc0eb62eadf703eace8c5332f876cb0fdecf5a1aaee3be06b81bdcf82} in 2022, several times lower than where it was in 2006.
Chart 9: Adjustable Rate Mortgages
MBA, JBREC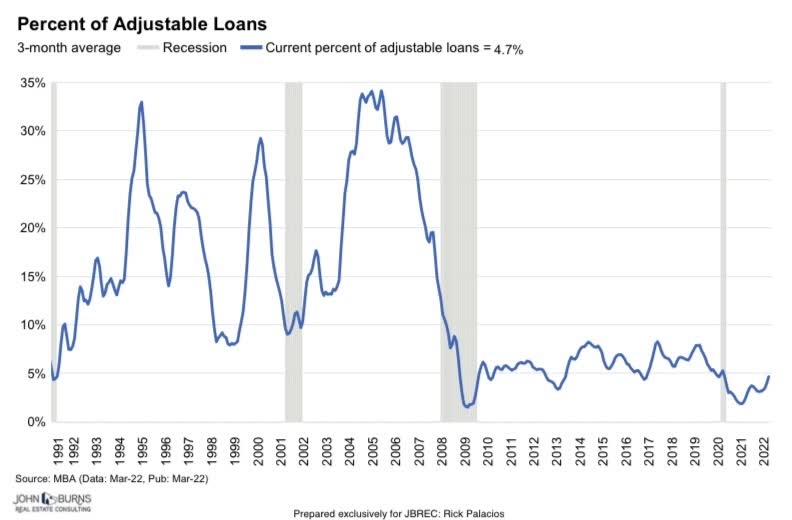
According to the Federal Reserve Bank of New York, the median credit score for mortgage borrowers hit an all-time high of 788 in 2021. Heading into the financial crisis, the median score was much lower at 707. Overall, mortgage underwriting standards and loan quality are both higher today than they were pre-GFC.
Borrower positions
When interest rates rose heading into the financial crisis, ARM borrowers who could barely make the initial lower payments struggled with higher debt service. That led to a tidal wave of foreclosures, flooded markets, and demand destruction that weighed on home prices for years.
Chart 10: U.S. Foreclosures
ATTOM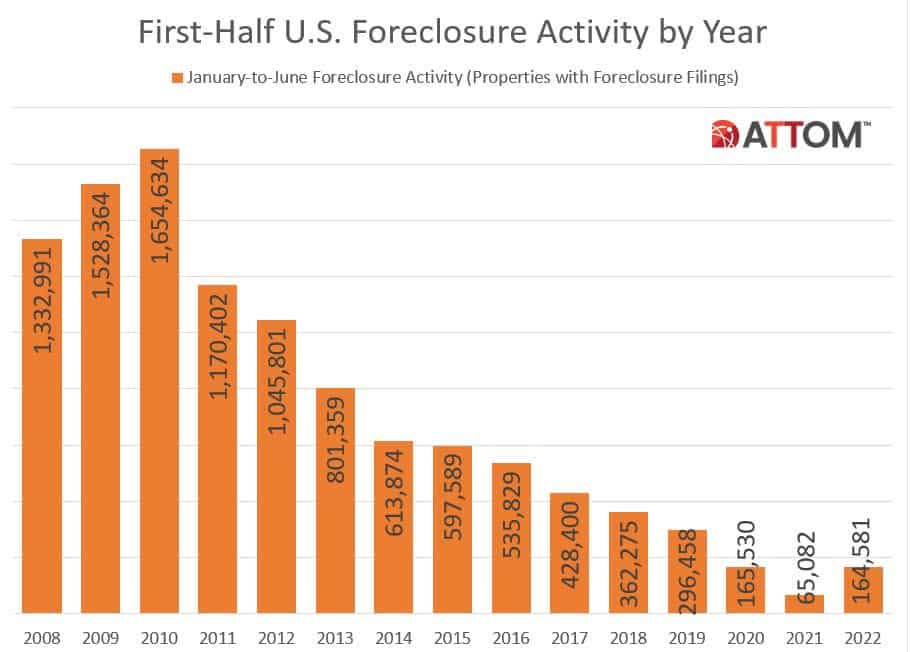
Rates are rising again in 2022, but unlike before fewer homeowners are exposed to higher payments because of the aforementioned reduction in ARM financing (Chart 9).
In addition, many current borrowers are locked in at low, fixed, long-term interest rates. Prior to the increase this year, mortgage rates were relatively low for almost two decades and hit a historic low as recently as 2020.
Chart 11: 30-Year Fixed Mortgage Rate
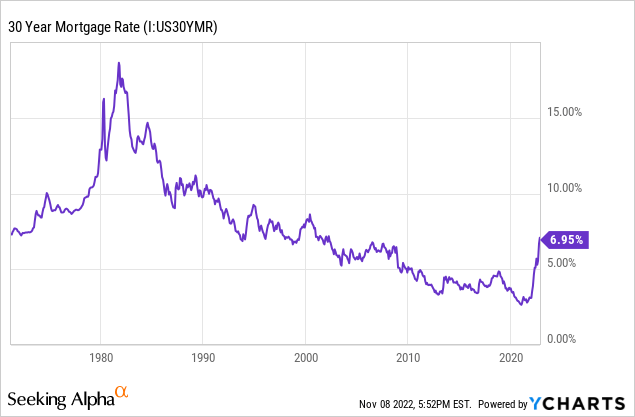
Despite sensational headlines about a huge jump in mortgage rates, 7{73375d9cc0eb62eadf703eace8c5332f876cb0fdecf5a1aaee3be06b81bdcf82} is actually just about normal based on long-term average levels.
Meanwhile, homeowners are also sitting on a record amount of home equity due to stricter underwriting, larger down payments, and a decade’s worth of appreciation.
Chart 12: Homeowner Equity
FRED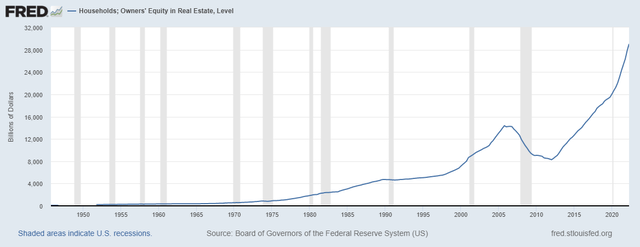
That equity provides homeowners with some cushion and puts borrowers in a stronger position today versus the overleveraged, underqualified, and underwater borrowers from the financial crisis.
The bottom line
None of this means housing prices will not fall. On the contrary, the pandemic price spike and rising interest rates make a near-term housing price decline a near certainty, and some regions will fall harder than others.
However, that is different from expecting a GFC-style crash when home prices broadly fell by -30{73375d9cc0eb62eadf703eace8c5332f876cb0fdecf5a1aaee3be06b81bdcf82}, -50{73375d9cc0eb62eadf703eace8c5332f876cb0fdecf5a1aaee3be06b81bdcf82}, and even more in some cases. Is that possible? Of course, anything is possible. If interest rates continue to climb unabated to double digits, that would likely trigger a massive real estate crash. However, that is not my baseline expectation.
I expect the Fed and markets will reverse course on interest rates as the economy contracts. Recession would hurt real estate prices, but the stronger financial position of homeowners makes a GFC-style flood of foreclosures and fire sales unlikely. Meanwhile, demand will continue to build from household formation and chronically low housing inventory, recession or not.
Bull or bear, we all need a place to live and most people want a home to call their own. As prices fall, home ownership becomes realistic for more people. Many will choose to buy what they need and can afford instead of waiting for the next GFC-style crash. That is how I expect this cycle to end, less sensational nightmare and more mundane reality.

